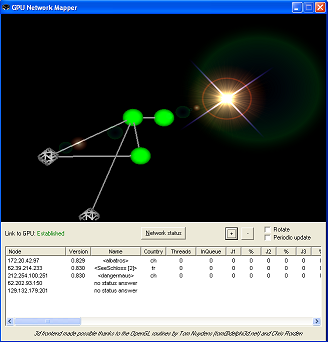
Figure 14: The frontend "Network Mapper"

Figure 14: The frontend "Network Mapper"
A good framework for distributed computing should offer a way to monitor the status of the ongoing computations. GPU does it only in a primitive way, by applying the plugin-frontend idea once more.
The frontend sends a gpustatus command to GPU, which then spreads the command through the Gnutella network. All connected GPUs, even if they are busy10answer with status information; in particular, they send back the percentage of ongoing computations, the number of jobs waiting in queue and the other GPUs they are connected with. Further information like Gnutella up and download traffic, IP number, node name and country complete their report.
All answers are stored by the frontend "Network Mapper" in a list. After a while (2-3 seconds) a simple algorithm is started on the data; from the IP address information, it builds a 3D graph11 on how the computers are connected. Nodes are green solid spheres if they are idle or blue, violet and red depending on how many computations they are executing. Connections between nodes are plotted as lines.
For the moment, nodes are placed randomly in spheres that increase their radius according to their incoming ticket. Later, we might want to place nodes so that the length of connections reflect the distance between nodes12 though it requires much more complex algorithms.
Gray wire spheres are plotted by the algorithm if other nodes reported the existence of a computer, although that computer did not explicitely answer our status request. That answer might got lost in a network congestion, because the node recently went down or because it is an older version that does not implement the status request13 feature.